top of page

Stephen Bell Elementary
Grades K-2
Bell Creek Intermediate
Grades 3-5
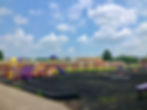
Jake Andrew Chappars Memorial Play Place
Playground at Bell Creek Intermediate
Stephen Bell Elementary
Grades K-2
1/5
The BSS Nov. 2019 Five-Year Budget Forecast

Here, we'll break down the line items a little so this forecast is hopefully easier to understand. Schools are required to put a five-year forecast together twice a year, once at the end of a school year and once in the late fall. This is so the state can keep tabs on the financial health of a district. They require the school's treasurer to put together what is essentially an educated guess based on past figures and estimates of future expenditures and revenue.
At the very top, you'll see two categories. 'Actual' is how much the school received and spent in fiscal years 2017 (16-17), 2018 (17-18), and 2019 (18-19). The other category is 'Forecasted', which are the following five years. We are currently in fiscal year 2020 (19-20). It's in the forecasted section, because until the year is complete those numbers are still estimates. The little middle column that's not included in 'Actual' or 'Forecasted' is 'Average Change'. It's the percentage of change that happened between fiscal years 2017/2018 and fiscal years 2018/2019 averaged out. To give an example, the top row, 1.010,
For ease, we'll just go over the rows that have numbers in them.
Revenues:
-
1.010 - General Property Tax (Real Estate): This is how much the school gets from inside and outside millage.
-
1.035 - Unrestricted State Grants-In-Aid: This is the 'per pupil' total that the school gets from the state that has no restrictions on how it's spent. It has not seen much growth recently. This line item includes the state foundation funding and $145,000 from State Casino Revenues. *A comparison of the last decade of funding is below.
-
1.040 - Restricted State Grants-In-Aid: This includes Career Tech and Economically Disadvantaged student funding only.
-
1.050 - Property Tax Allocation: This is the state's portion of the homestead exemption and owner occupancy credit.
-
1.060 - All Other Revenues: This includes transportation reimbursements, class fees, refunds, rentals, tuition, participation fees, and all other miscellaneous revenues.
Other Financing Sources:
-
2.050 - Advances-In: This is another way of saying 'borrowing from tomorrow'. The school is borrowing from their future budget.
-
2.060 - All Other Financing Sources: This includes refund of prior year expenditures and sale of equipment.
Expenditures:
-
3.010 - Personal Services: This is the line item for employee wages.
-
3.020 - Employees' Retirement/Insurance Benefits: This is the total BSS pays for the staffs' state mandated pension plans as well as their health, dental, vision, and life insurance.
-
3.030 - Purchased Services: This is the total BSS pays for things like fuel, utilities, building repair services, legal fees, professional meetings, mandated special education teacher assistants, Greene County Educational Services Center, etc.
-
3.040 - Supplies and Materials: This one's pretty self explanatory. These are the products a school buys. Paper, soap, TP, books, chairs, etc.
-
3.050 - Capital Outlay: This is the line item for expenses involving buildings, buses, and technology.
-
4.010-4.060 - Debt Principal and Interests: These all have to do with paying back the loan the school took out for HB 264 Energy Savings Project.
Other Financing Uses:
-
5.010 - Operating Transfers-Out: We're not positive on this one. It, however, represents $10,000 of a $30+ million dollar budget. So whatever it is, it's not a big expenditure.
-
5.020 - Advances-Out: Is repayments of Advances-In.
Lines 7.020, 10.010, 12.010, and 15.010 all say the same thing. They are the total expenditures subtracted out of the total revenue. These are the line items that starkly show the deficit facing BSS. Without an additional revenue source to offset the estimated increasing costs of running a school with little to no additional help from the state, the school has no option but to eliminate as many expenses as it can. See the Audit report in the next section for more on that.
Line 20.010 is the Kindergarten headcount in October.
Line 20.015 is the 1-12 Student body total in October. Please note that the preschool is not included in these numbers even though a portion of the preschool is payed for by the school.
*The following chart is how much BSS got from the state in fiscal years 2009-2019. These numbers were pulled directly from the last decades worth of five-year forecasts. As we've mentioned before $20 could buy more in the past than it can today, in fact in 2009 it bought $3.96 more than it does today. Using this website, we looked at how much the school is getting based on how much a dollar was worth in 2009 and in 2020. You'll see the same pattern emerge. Strictly looking at how much a dollar buys, BSS has been getting less and less money from the state.

To help visual these numbers we turned them into a line graphs using both the 2009 and 2020 adjusted inflation amounts. You'll see, that while not identical, the two graphs bare a striking resemblance. We then added the student body population to show how the state funding compares to the number of children the school has been tasked with educating.
2009


2020


No matter which way you account for inflation, the downward trend in state funding is clear. As is the increase in student population. Someone once asked us why does it feel like the school suddenly had NO money after 2015. We talked about the complications of HB920 and the stagnation of state funding, but when we put this graph together it put the answer to his question in pretty stark perspective. A mostly fixed income, less and less usable money from the state, and more students make for difficult budgeting.
Below is the BSS' budget compared to Similar District Averages, Statewide Averages, Beavercreek Schools, Centerville Schools, and Oakwood Schools.


bottom of page